
Product challenge
Too much information at once
Charts, tables and summaries compete for attention unless the page reflects the decisions users need to make.

Data & analytics
Dashboard and data visualization design for analytics products. Explore music analytics and property monitoring work, with reusable charts, tables and filters.
Product challenge
Charts, tables and summaries compete for attention unless the page reflects the decisions users need to make.

Our starting point
Identify who uses the data, which questions they ask and how often they return. Agree on definitions, source limitations and meaningful comparisons.
Violations, permits, hearings and notifications brought into a single overview.
A useful dashboard helps someone understand a situation, compare information or identify an action. Our work spans music promotion analytics, property monitoring and student wellbeing assessments. Each requires a different information model, but all depend on readable hierarchy, clear context and consistent visual patterns.
Charts, tables and summaries compete for attention unless the page reflects the decisions users need to make.
Color, time ranges, units and filters need to communicate consistently when users compare multiple data series.
People need a route from overview to supporting detail, especially when the information identifies an issue.
Identify who uses the data, which questions they ask and how often they return. Agree on definitions, source limitations and meaningful comparisons.
Design the hierarchy between summaries, charts, tables and detail views. Preserve context when users filter, compare or drill into information.

Define chart colors, labels, legends, units and states. Carry the same rules across dashboards and implementation documentation.

Review sparse, dense, missing and changing datasets. Validate comprehension and visual QA with the product and engineering teams.
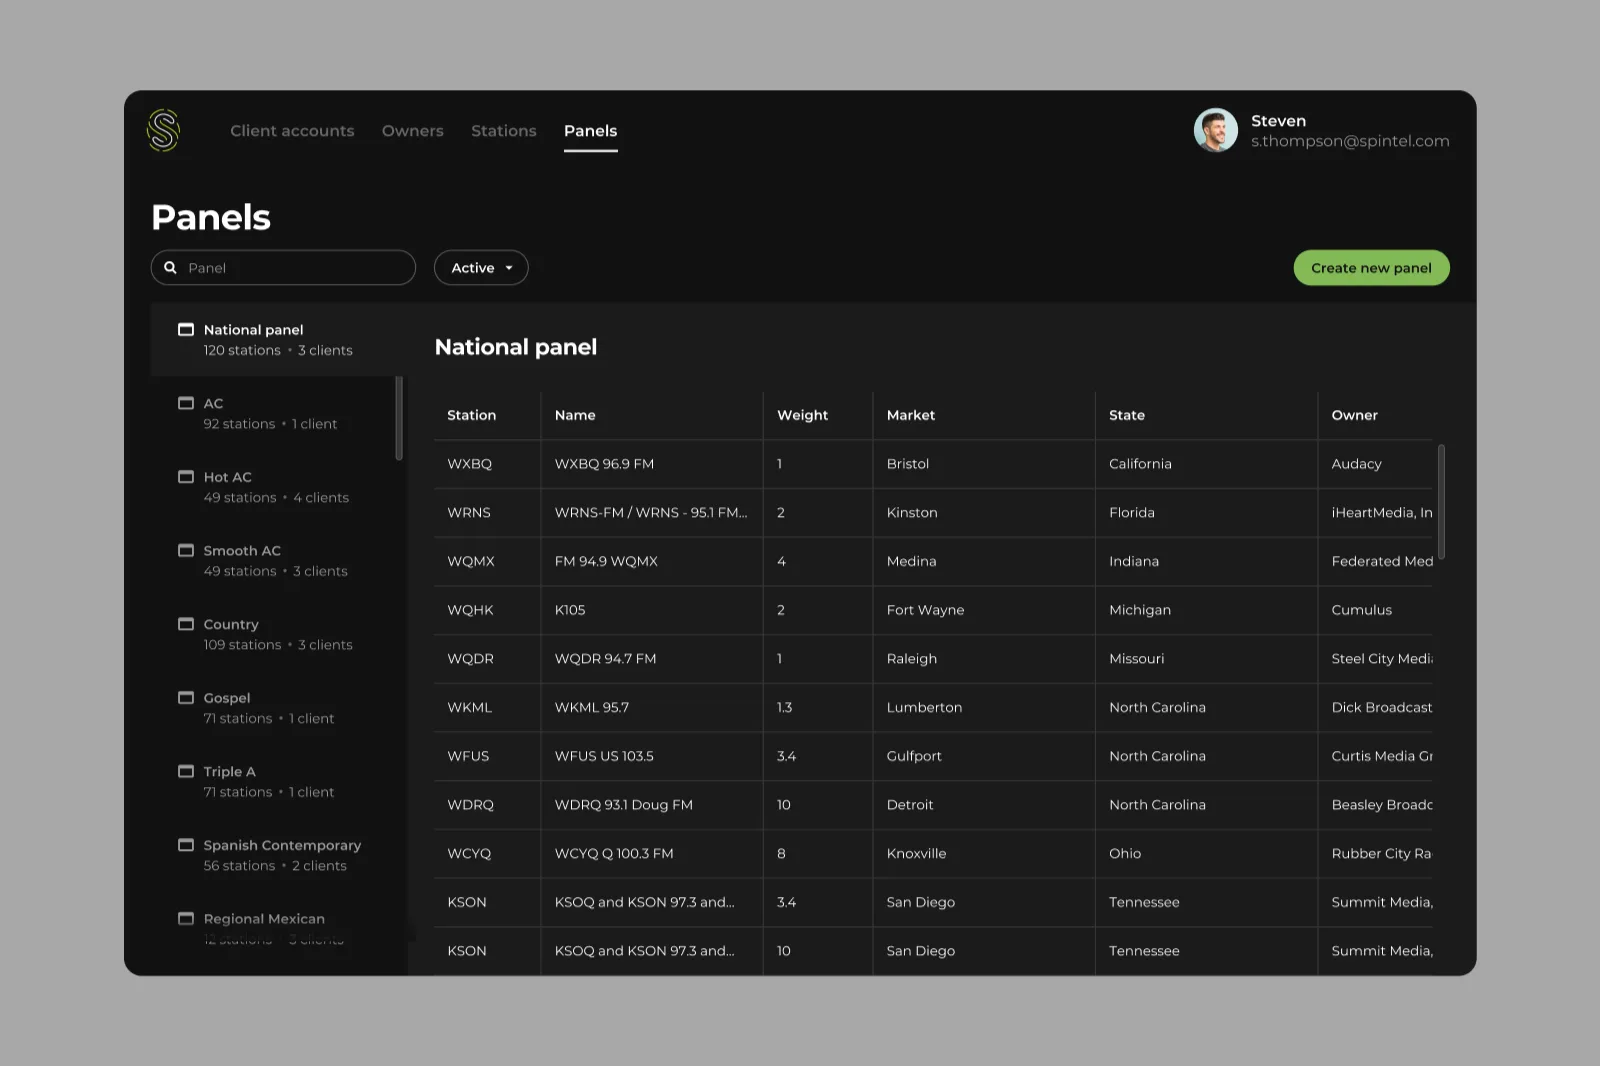
A B2B platform connecting dense information with a structured visual language and design system.
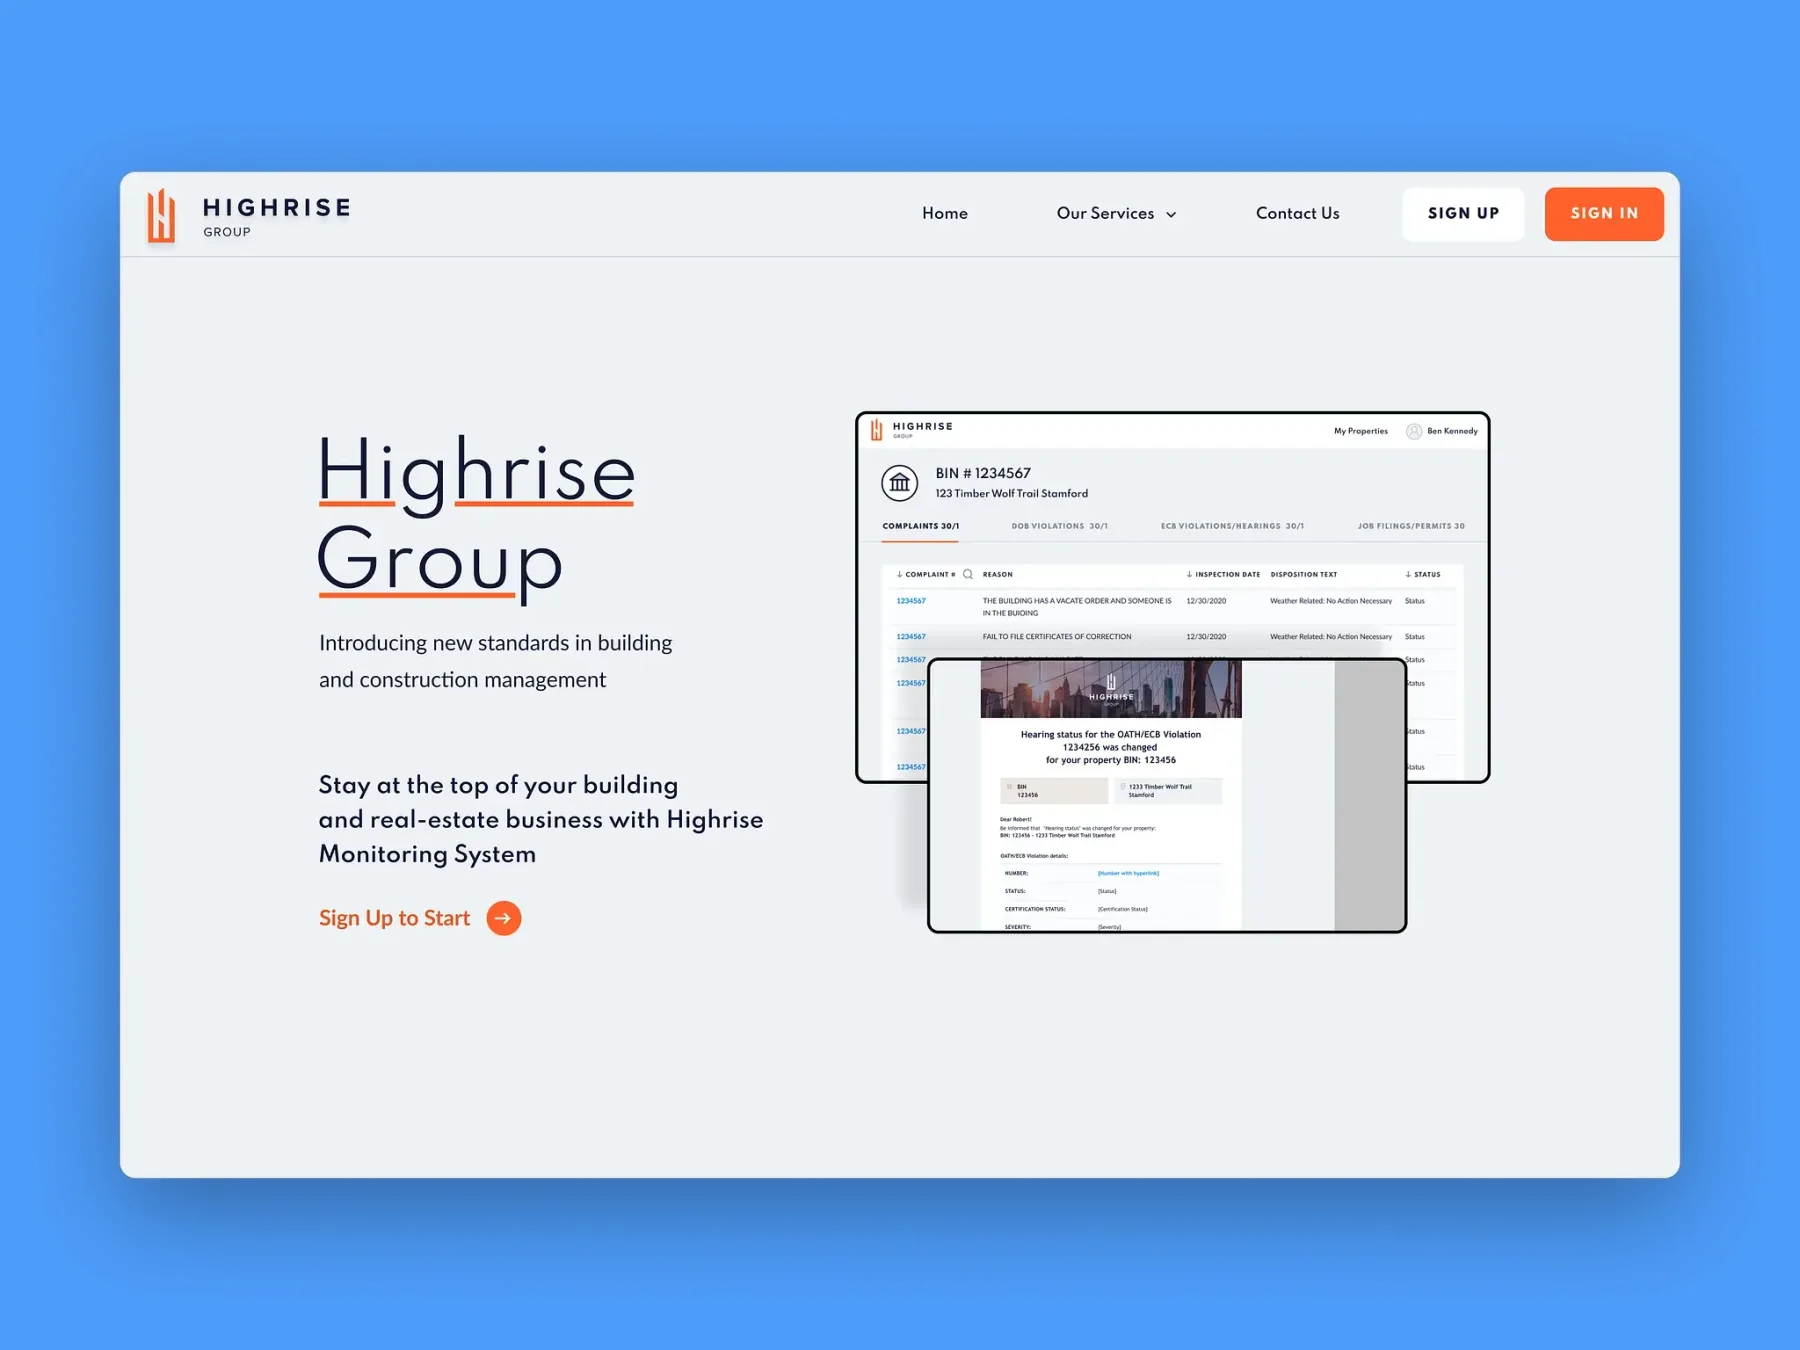
Property dashboards with search, filters and clear information about violations, permits and deadlines.
UX structure, prototyping, interface design and implementation support for SaaS, marketplaces, mobile apps and complex digital products.
Figma libraries, semantic tokens, reusable UI components, product patterns, documentation and adoption support.
Functional prototypes, production frontend interfaces, mobile experiences and reusable design systems in code.
SaaS product design for onboarding, dashboards and complex workflows. Explore Clearl’s analytics and operational platform work, UX audits and design systems.
Explore industryPropTech product design for property portfolios, compliance tracking and operational dashboards. Explore Clearl’s property monitoring platform experience.
Explore industryProduct design for wellbeing assessments and fitness experiences. Explore Clearl’s work with student wellbeing dashboards and the Fitpool mobile platform.
Explore industryBring the questions your users need to answer and the data they currently work with.
Discuss your product